Verdict
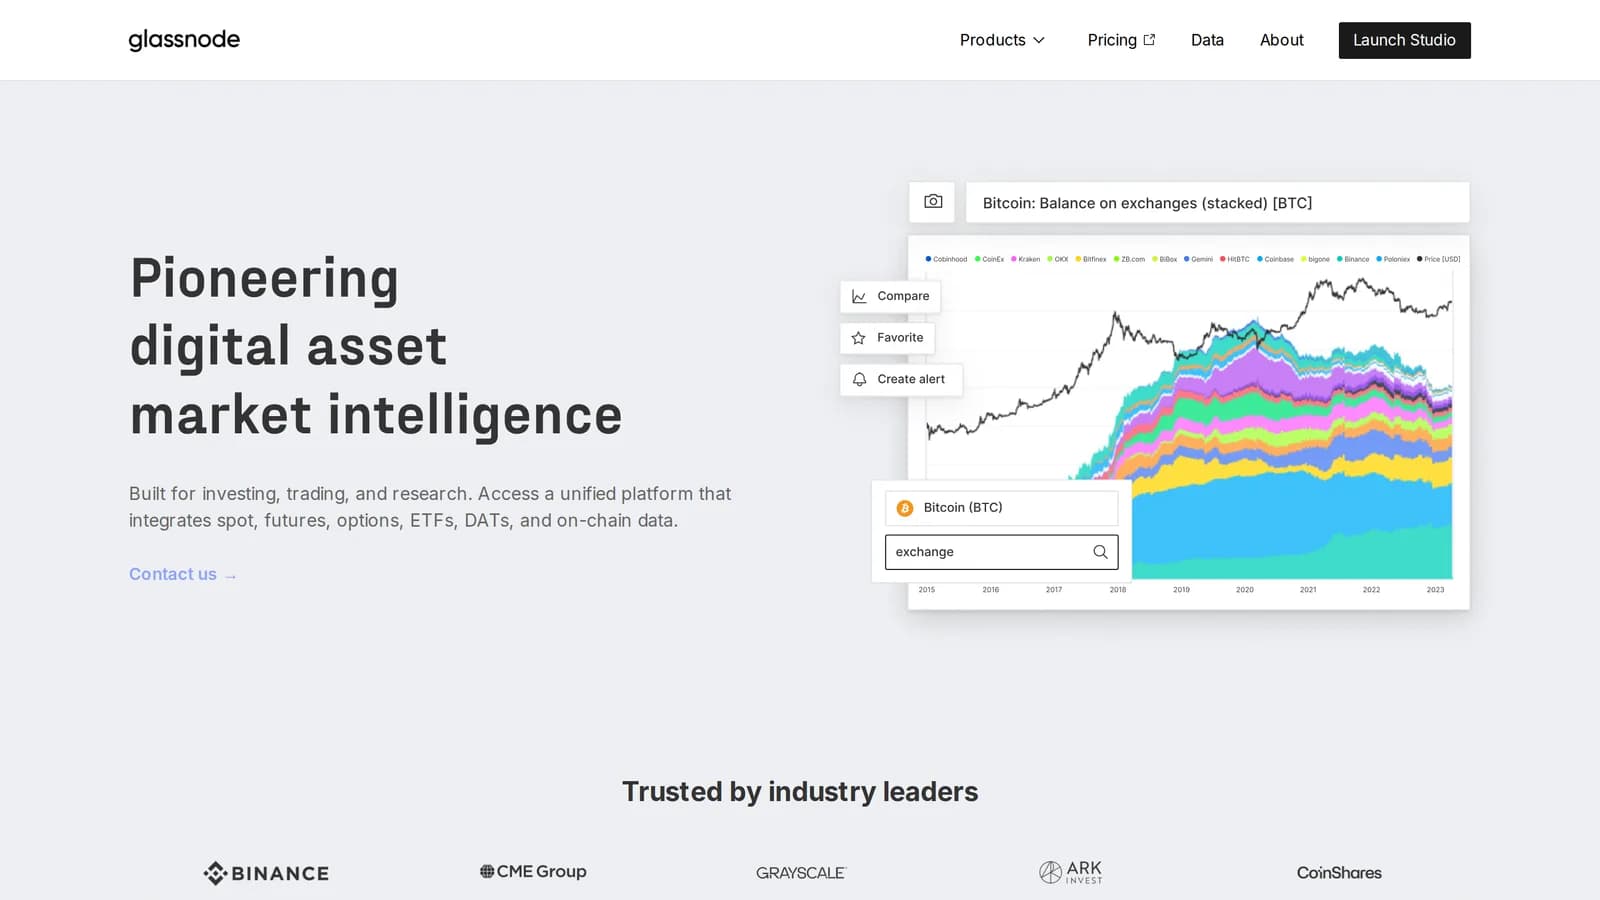
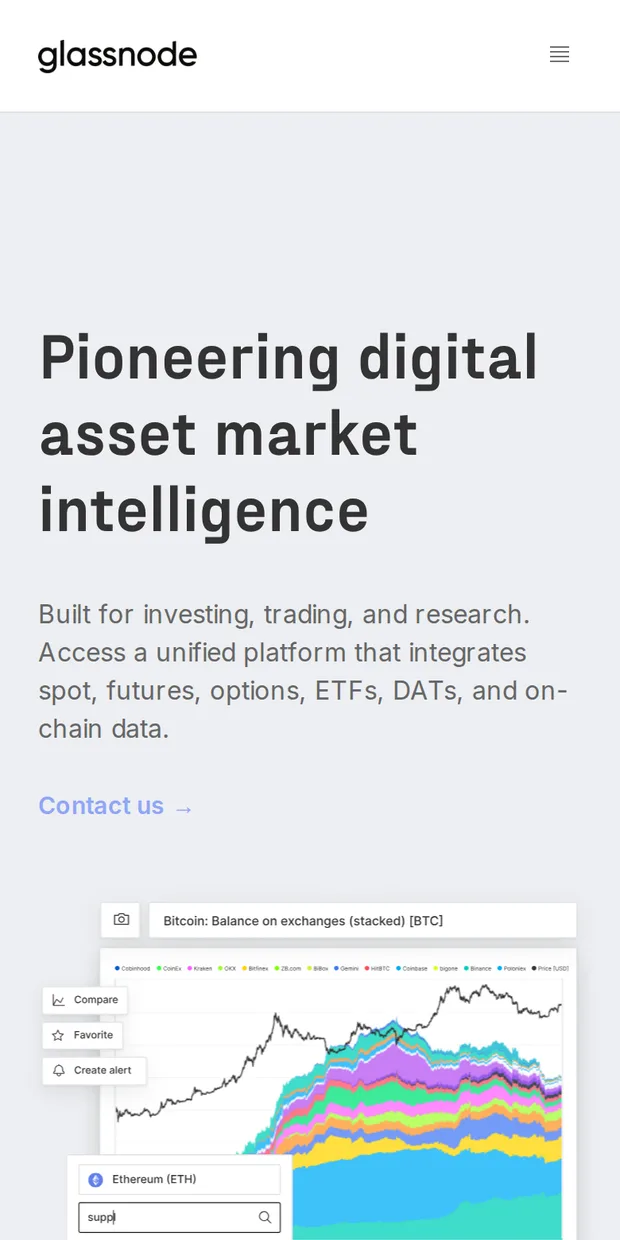
The reference source for Bitcoin on-chain analytics, with a metric library that is both its greatest strength and its biggest trap. The professional tier is priced for desks; the entry tier covers most of what an individual can actually act on.
- Best for
- Bitcoin on-chain analysis and cycle context
- Cost
- Free tier; entry paid tier ~$39/month
What works
- The deepest Bitcoin on-chain metric library available anywhere
- Methodology for each metric is documented, including its limitations
- Published research notes explain what a metric does and does not show
- Free tier includes enough long-horizon context to be genuinely useful
What does not
- The professional tier's cost puts the best metrics out of individual reach
- Entity-adjusted heuristics are estimates presented with great precision
- On-chain analysis of ETF-era Bitcoin misses a growing share of real flow
- Metric abundance encourages hunting for the chart that agrees with you
Terms like realised cap, SOPR, coin days destroyed and long-term holder supply entered common usage largely through Glassnode. Whatever you think of on-chain analysis as a discipline, this is the company that made it legible to people who do not run their own node.
What it is genuinely good at
Bitcoin. The metric library for BTC is deeper than anything else available, the methodology notes explain how each figure is constructed, and the published research is unusually honest about what a metric cannot tell you — which is rare in a business that sells signals.
The most valuable material is the long-horizon supply analysis: how much coin has not moved in years, what cost-basis cohorts look like, how holder behaviour has shifted across cycles. These are slow-moving structural observations, and they are what on-chain data is actually good for. Nothing here will tell you what happens this afternoon, and the honest research does not claim to.

The trap
There are hundreds of metrics. At any given moment, some of them are bullish and some are bearish. A user who arrives holding a position and goes looking for confirmation will find it in under a minute, every single time, and will feel considerably more informed afterwards.
Decide which metrics you trust and why, in writing, before you look at them.
Prefer slow structural measures over anything that updates hourly.
Treat a metric you had never heard of until it agreed with you as noise until proven otherwise.
Write down in advance what would change your mind, then check whether that metric has moved.
A metric library large enough to answer any question is a metric library large enough to confirm any prior. The discipline has to come from you, because the product cannot supply it.
Entity adjustment
Many headline figures rely on clustering heuristics that group addresses into estimated entities — exchanges, miners, funds. The heuristics are good, documented, and estimates. They are presented with a decimal precision that the underlying inference does not support.
Treat entity-adjusted numbers as directionally useful and not as measurements. A 3% change in an entity-adjusted supply figure may be a real flow or may be a clustering revision.
The ETF problem
On-chain analysis assumes economic activity leaves a trace on the chain. A growing share of Bitcoin exposure is now expressed through ETFs, where the underlying coins sit in custody and shares trade on equity infrastructure. Enormous amounts of real buying and selling now happen without any on-chain footprint at all.
This is not Glassnode's fault and the company has written about it directly and repeatedly. It does mean on-chain signals that worked reliably in 2018 are now measuring a smaller and less representative share of the market, and anyone using cycle comparisons should adjust for that rather than assume the indicator means what it used to.
Pricing
The free tier carries a useful set of long-horizon charts and is enough for someone who checks in monthly. The entry paid tier at around $39 a month unlocks a broad metric range and is the right level for a serious individual. The professional tier runs into the high hundreds monthly and is priced for desks that need intraday resolution and API access.
Verdict
Beyond Bitcoin
Ethereum coverage is solid and improving, with staking flows, gas dynamics and exchange balances tracked in the same framework. Coverage of other chains is thinner and the metric set is smaller, largely because the analytical vocabulary that works for Bitcoin does not transfer cleanly to a chain where most activity happens inside contracts.
That is an honest limitation of the discipline rather than of the product. Supply-side cohort analysis means something for an asset held as a store of value and much less for one that is constantly being deposited, borrowed against and wrapped.
The research notes
The published research is the most underrated part of the subscription. It explains what a metric is measuring, how it was constructed and what it cannot support — and it periodically concludes that an indicator people rely on has stopped working.
A data company willing to publish that its own metric is less informative than it used to be is doing something the rest of this category does not. Read the notes before the charts.
Score: 7.9. The best on-chain data product available, honest about its own methodology, and increasingly measuring a partial view of the market through no fault of its own. Buy the entry tier if you hold Bitcoin seriously; skip it entirely if you would use it to justify trades you had already decided on.